What is Microsoft Excel ?
Microsoft Excel is a proprietary commercial spreadsheet application written and distributed by Microsoft for Windows and Mac OS. It features calculation, graphing tools, pivot tables, and a macro programming language called Visual Basic for Applications. It has been a very extensively applied in all fields. Especially since version 5 in 1993 and it has almost completely replaced Lotus 1-2-3 as the industry standard for spreadsheets. Excel is a part of Microsoft Office. The current versions are 2010 for Windows and Mac OS. Also Microsoft® Office 365 is a new version product of Microsoft.
Microsoft Excel 2007 is the newest version of Microsoft Office’s worksheet (spreadsheet) program.

A worksheet is an object in a spreadsheet program that consists primarily of a grid of cells, organized in rows and column, in which spreadsheet calculations and information are held. A file saved by a spreadsheet program may consist of many worksheets. A Tab (Default name of a Tab is”Sheet1") is call one a Sheet & a group of Tab or Sheet is call Worksheet.
Please visit the following link to learn more . . .
http://exceldoeasy.weebly.com/
Microsoft Excel is a proprietary commercial spreadsheet application written and distributed by Microsoft for Windows and Mac OS. It features calculation, graphing tools, pivot tables, and a macro programming language called Visual Basic for Applications. It has been a very extensively applied in all fields. Especially since version 5 in 1993 and it has almost completely replaced Lotus 1-2-3 as the industry standard for spreadsheets. Excel is a part of Microsoft Office. The current versions are 2010 for Windows and Mac OS. Also Microsoft® Office 365 is a new version product of Microsoft.
Microsoft Excel 2007 Introduction.

A
worksheet is a single document inside a workbook but we often use the
terms worksheet, spreadsheet and workbook interchangeably. Worksheets
contain numerical information presented in tab row and column format
with text that labels the data.
They can also contain graphics and charts. Excel 2007 takes advantage of a new, results-oriented user interface to make powerful productivity tools easily accessible. If you’re worried about capacity, Excel 2007 now accommodates 1 million (1048576) rows, 16,000 (16384) columns & 17179869184 Cells. In Excel 2007, you could have up to 32,000 data points in a data series for 2-D charts.
They can also contain graphics and charts. Excel 2007 takes advantage of a new, results-oriented user interface to make powerful productivity tools easily accessible. If you’re worried about capacity, Excel 2007 now accommodates 1 million (1048576) rows, 16,000 (16384) columns & 17179869184 Cells. In Excel 2007, you could have up to 32,000 data points in a data series for 2-D charts.
Microsoft Excel 2010 Introduction.

Microsoft
Excel 2010 is the newest version of Microsoft Excel 2007, Microsoft
Excel 2010 now accommodates 1 million(1048576) rows, 16,000
(16384)columns & 17179869184 Cells. (Same as 2007)
But in Microsoft 2010 has improved in RIBBON interface,
But in Microsoft 2010 has improved in RIBBON interface,
Recover previous versions : - You
can recover files versions of files that you closed without saving in
Excel 2010(This is helpful when you forget to manually save)
Protected view : - Excel 2010 includes a Protected View, so you can make more knowledgeable judgments before revealing your computer to possible susceptibilities. By default, documents that originate from an Internet source are opened in Protected View.
Sparkline: - You can use Spark-line small charts that fit in a cell to visually summarize trends along side data. Because Spark-line show trends in a small amount of space, they are exclusively useful for dashboards.
Improved Pivot Tables: - In Microsoft Excel 2010, multitasking help you speed up data recovery, sorting, and filtering in Pivot Tables. It's now conceivable to fill down labels in a Pivot Table so that you can work more easily use the Pivot Table. You can also repeat labels in Pivot Tables to display item captions of nested fields in all rows and columns
New search filter: - In Microsoft Excel when you filtering data in Excel tables, Pivot Tables, and Pivot Charts, you can take benefit of a new search box, which helps you to find quickly what you need in large worksheets.
New charting limits: - In Microsoft Excel 2010, the number of data points in a data series is limited only by available memory
Why Use Microsoft Excel ?
Microsoft
Office Excel is a powerful tool used to create and format spreadsheets.
Spreadsheets allow information to be organized in rows and tables and
evaluated with automatic mathematics. Spreadsheets are frequently be
used to perform many different types of calculations. Excel helps us to:
-
• Navigate Cells
• Manipulate Data
• Use Formulas and Functions
• Create Charts and Tables, and many more.
With Excel you can analyze, manage and share information quickly and easily to make more informed decisions. With the new user interface, rich data visualization, and Pivot Table views, professional-looking charts.
Microsoft Office Share Point Server 2007, brings with it significant improvements to data sharing and security. By sharing a spreadsheet using Office Excel 2007 and Excel Services, you can navigate, sort, filter, input parameters, and interact with Pivot Table views directly on the Web browser.
What is a Spreadsheet ?
A spreadsheet is
a computer application that simulates a paper accounting worksheet. It
displays multiple cells usually in a two-dimensional matrix or grid
consisting of rows and columns. Each cell contains alphanumeric text,
numeric values or formulas. A formula defines how the content of that
cell is to be calculated from the contents of any other cell (or
combination of cells) each time any cell is updated. Spreadsheets are
frequently used for financial information because of their ability to
re-calculate the entire sheet automatically after a change to a single
cell is made. A pseudo third dimension to the matrix is sometimes
applied as another layer, or layers/sheets, of two-dimensional data.
What is a Workbook ?
When you open Excel, a new file is created called Book 1 (You can rename it to identify) it call Book or Workbook initially made up of three & you can create more
What is a Worksheet ?
A worksheet is an object in a spreadsheet program that consists primarily of a grid of cells, organized in rows and column, in which spreadsheet calculations and information are held. A file saved by a spreadsheet program may consist of many worksheets. A Tab (Default name of a Tab is”Sheet1") is call one a Sheet & a group of Tab or Sheet is call Worksheet.

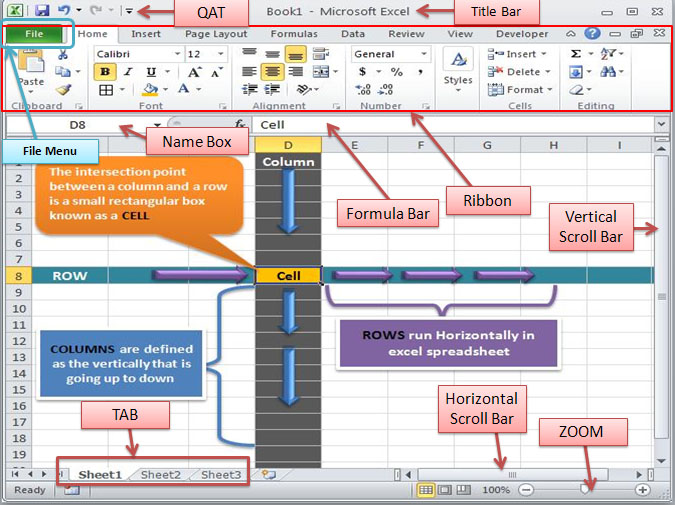
What is Ribbon ?
When you first start some of the programs in 2007 Microsoft Office system, you may be surprised by what you see. The menus and toolbar in some programs have been replaced with the Ribbon.The Ribbon is the strip of buttons and icons located above the work area in Excel 2007 and Excel 2010. Above the Ribbon are a number of tabs, such as Home, Insert, and Page Layout. Clicking on a tab displays the options located in this section of the ribbon.The Ribbon is designed to help you quickly find the commands that you need to complete a task. Commands are organized in logical groups, which are collected together under tabs. Each tab relates to a type of activity, such as writing or laying out a page. To reduce clutter, some tabs are shown only when needed. For example, the Picture Tools tab is shown only when a picture is selected.These options are grouped according to their function - such as Clipboard (includes cut, copy, and paste options), and Font (includes current font, font size, bold, italic, and underline options) etc.
What is QAT?
The Quick Access Toolbar is a customizable toolbar that contains a set of commands that are independent of the tab that is currently displayed. You can add buttons that represent commands to the Quick Access Toolbar, and you can move the Quick Access Toolbar from one of the two possible locations.
What is a Row ?
In a spreadsheet the Rows
run horizontally in excel spreadsheet that is going across the in the
spreadsheet. They are identified by a number (1,2,3,10,120) in the row header.
(As seen in the picture) What is a Column ? In a spreadsheet the columns are defined as the vertically that is going up to down in the spreadsheet& latter (A, B, C, AA, AB) are use to identified each columns location.
(As seen in the picture)
What is a Cell ?
The intersection point between a column and a row is a small
rectangular box known as a cell. A cell is the basic unit for
storing data in the spreadsheet. Each Cell has a address or cell references. Each cell is
assigned a name according to Column latter (A) & Row Number
(1),Such as cell address or reference is "A1".
(As seen in the picture) | 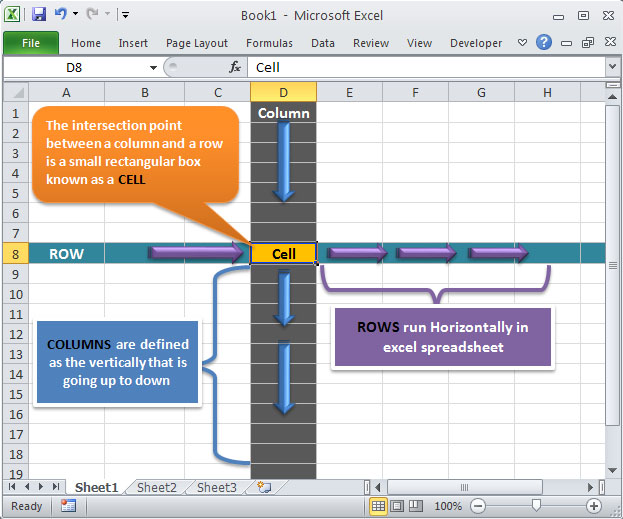 |
Please visit the following link to learn more . . .
http://exceldoeasy.weebly.com/
Awesome post. Thank you for sharing a best comments to us. Other wise Any one who want to learn excel core to advance contact us on contact us on on 9311002620 or visit our further websites :- https://www.htsindia.com/Courses/Business-Analytics/adv-excel-training-course
ReplyDelete